I was selected as a mentee for PostgreSQL in GSoC 2022 for a project titled GUI representation of monitoring System Activity with the system_stats Extension in pgAdmin 4. The project focuses on applications for PostgreSQL wherein system-level statistics are represented on the pgAdmin 4 dashboard using the system_stats extension with the help of graphical metrics. This allows users to interact with system metrics of the PostgreSQL database servers with heavy detailing on important performance indicators related to OS, CPU, Memory, Disk, I/O, networking, etc.
The statistics allow the user to understand the usage of resources in OS, analyse CPU performance and I/O completion with system interrupt status, get an in-depth understanding of memory usage and disk information, be able to track the network interface information and know how much memory is consumed by different processes running on the system.
My project stands as a true amalgamation of all the core subjects I have learnt as a computer science engineering student. Through the dashboard developed, I got a better understanding of analysing the core concepts learnt in Operating Systems, Database Management, Computer Networks, Memory etc all coming in as data points in the dynamic dashboard created. It was a truly hands-on experience, improving my grasp of the concepts learnt in BTech, by understanding the relevance of them in the real world.
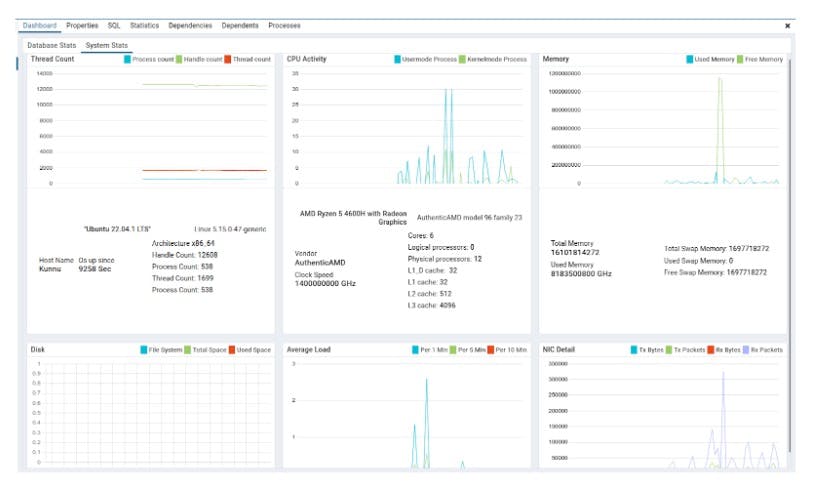
A comprehensive dashboard has been designed and developed to optimally represent all the system statistics that are relevant to the users, keeping it minimal and consistent to ensure user-friendliness. The users also possess the power to dynamically change the dashboard as per their preferences.

The graphical metrics in the above snapshot of the dashboard represent the following data:
- Thread count: The representation of process count at an instance and the resource usage of the OS is displayed.
- CPU Activity: The analysis of CPU performance and I/O completion with system interrupt status is displayed.
- Memory: The user can evaluate how much memory is consumed by different processes running on the system.
- Disk: The memory usage and disk information is displayed in depth.
- Average Load: The average system load calculated over a given period of time of 1, 5 and 10 minutes.
- NIC Detail: The network interface information can be tracked.
The tech stack of the project includes Flask for back-end, SQL for database, Grafana for testing endpoints, React for front-end, charts.js for graphs. By implementing the mentioned technologies and frameworks in the project created I was able to grow as a developer throughout the process.
Here are a few things that have improved my coding and communication through the summer:
- Learnt industry-level coding practices
- Learnt new skill sets like React,chart.js library, Grafana, MySQL with python
- Improved already developed skills further by contributing to open-source
- Widened perspective by looking at the level of granularity and thought put in code to make it efficient, modular, and optimal in terms of design and performance
- Better communication skills through regular mentor catch-up.
- Strengthened Documenting skills by putting thoughts to words while writing reports and tech blogs.
As parting thoughts, I would like to highlight that GSoC or for that matter open source is not a one person job, the deliverables are accomplished with the endless support from mentors who are there to help you whenever you are stuck. The emotional support that one derives from family, friends and the community.

